Hi, I'm Harsh Bhogal
Subject Matter Expert | Java & DSA | Data Science | Python With Django | ML | DL | AI | Web Developer
See MY WorkAbout Me

Hello! I'm a self-motivated and passionate tech enthusiast with a strong interest in
Artificial Intelligence, Machine Learning, and Full-Stack Development. I have a solid
foundation in Python, and I'm learning web development using Python and Django to build
dynamic, scalable applications.
I also have hands-on experience in data analytics, AI
model deployment, and love creating
smart solutions that address real-world challenges. I'm always eager to explore new
technologies, work on impactful projects, and grow as a future-ready tech professional.
- Location: Raipur, Chhattisgarh, India
- Email: harshbhogal1@gmail.com
- Education: B.tech in Computer Science Engineering (Artificial Intelligence)
Skills
Programming Languages
Frameworks & Libraries
Tools & Technologies
Experience

Python Developer Internship
CodSoft | 2023

Data Analytics Internship
Vodafone Idea Foundation | 2024

Student Ambassador
LetsUpgrade | 2024
Data Science Internship
Internship Studio | 2024

AI & ML Virtual Internship
Eduskills Foundation | 2025
Backend Developer Training
RAYS IT & DESIGN WORLD | 2025 Present
Projects
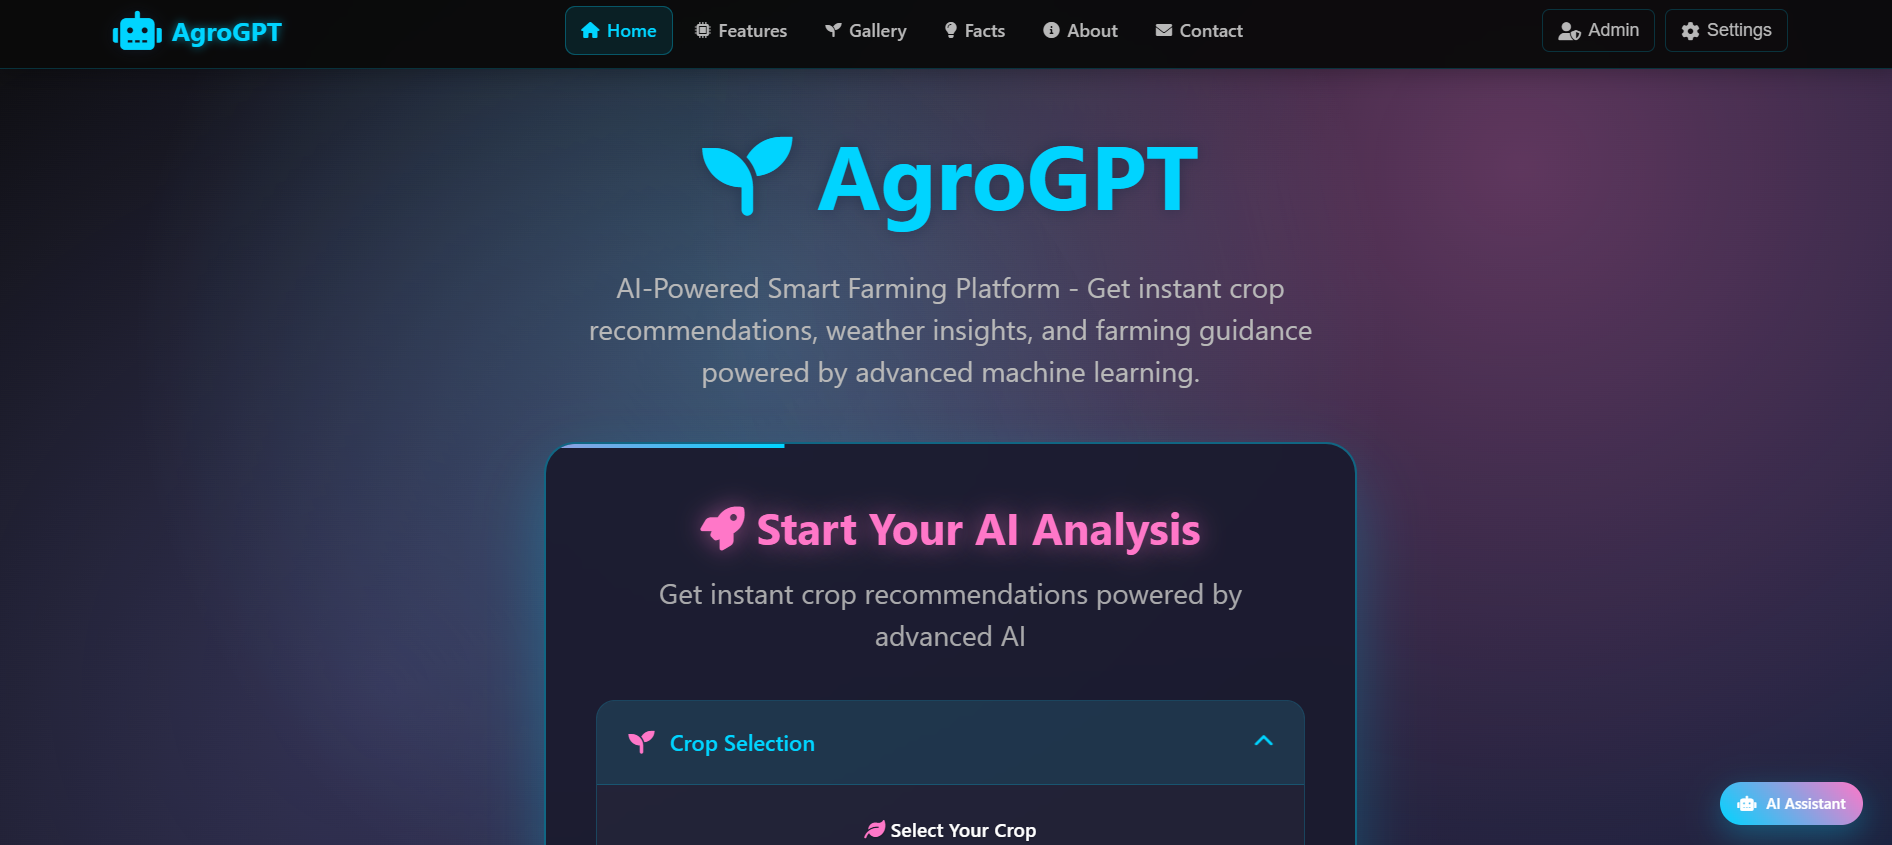
AgroGPT is an advanced AI-based system designed to support farmers in making intelligent, data-driven agricultural decisions. It integrates seven core modules including crop recommendation, fertilizer suggestion, soil health analysis, weather-smart planning, pest/disease alerts, crop yield prediction, and market price forecasting. Trained on over 2 lakh synthetic records per module, AgroGPT delivers highly accurate predictions (97%+ across models) using supervised machine learning algorithms like XGBoost, LightGBM, and Scikit-learn. The system features a Django-based web dashboard with login/logout and settings functionality, as well as a CLI chatbot assistant for offline or low-resource environments.
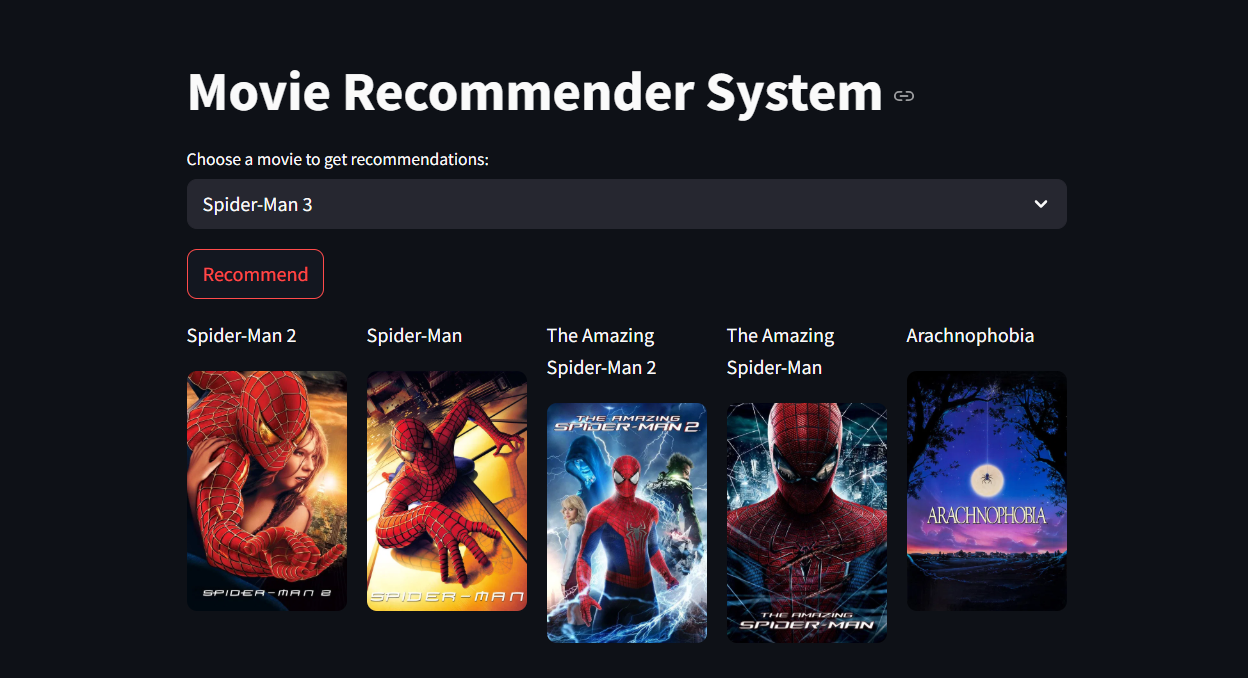
The Movie Recommendation System is built using machine learning techniques to suggest relevant movies based on a selected title. It applies content-based filtering by extracting features like genres and descriptions, then uses TF-IDF vectorization to convert text into numerical format. Cosine similarity is calculated to measure the closeness between movies, allowing the system to recommend top matches. The model is trained and evaluated using Python libraries like Scikit-learn and Pandas. Key ML concepts applied include text processing, vectorization, feature extraction, and similarity scoring, making it a practical application of machine learning in recommendation systems.
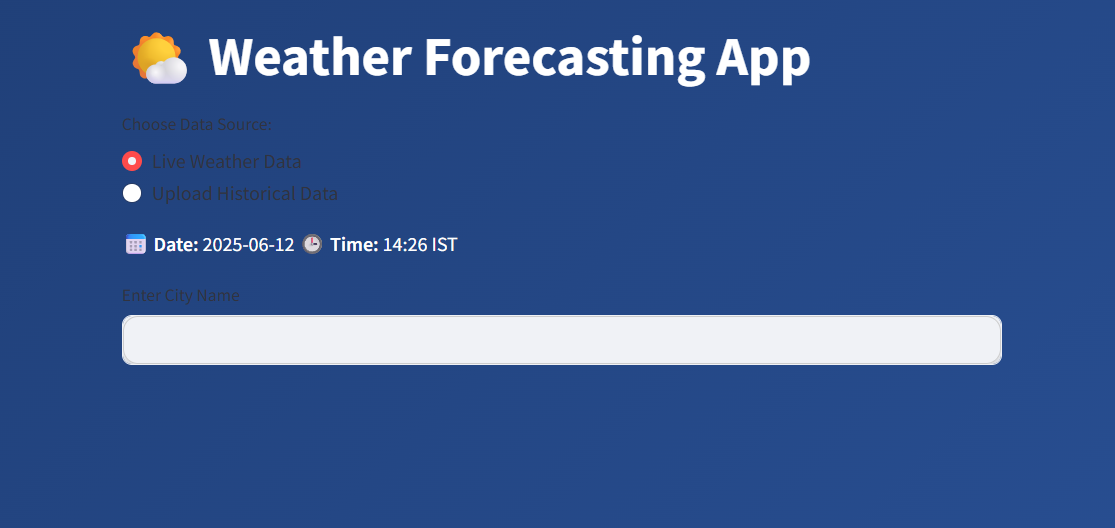
The Weather Forecasting System is a machine learning‑powered tool designed to forecast key weather parameters—such as temperature, humidity, and rainfall—using historical Indian meteorological data. The project begins with extensive data preprocessing, addressing missing values, feature engineering (like lag variables and seasonal categorization), and normalization. It employs regression algorithms—including Linear Regression and Random Forest Regressor—to train predictive models with cross‑validation, optimizing for accuracy and robustness. Visualization tools like Matplotlib and Seaborn are used to illustrate weather trends, error distributions, and feature importances. The system is built with Python and deployed as an interactive app via Streamlit, enabling users to enter a location and date to receive real‑time, location‑based forecasts with intuitive graphs and insights.
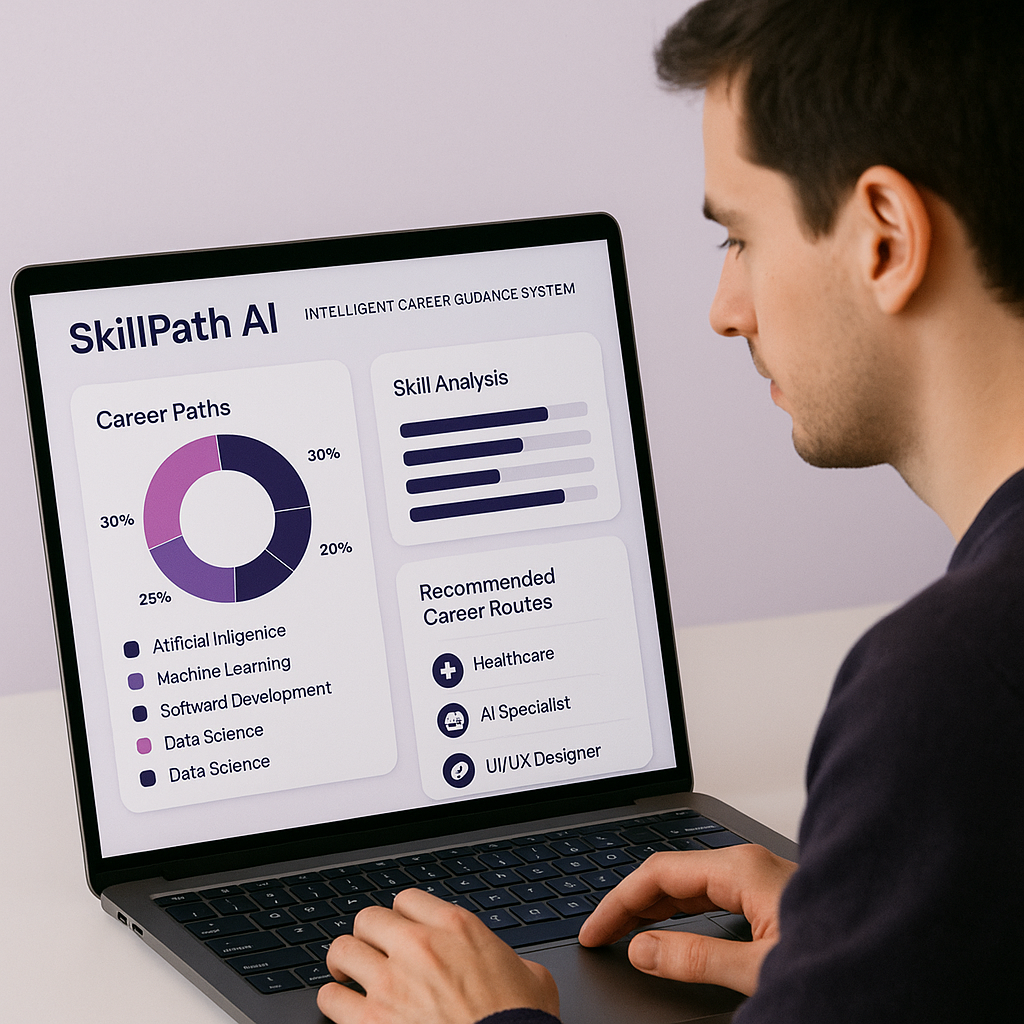
SkillPath AI is an intelligent, machine learning-based career guidance system that recommends ideal career paths based on a user's skills, interests, and academic background. Trained on a dataset of 7,000+ records, it predicts suitable job roles and generates a 📘 personalized learning roadmap with relevant tools, technologies, and course suggestions.Built using Python, Scikit-learn, and Streamlit, the system uses classification algorithms like Decision Trees and Random Forests to make accurate predictions. The interactive dashboard provides a user-friendly experience with real-time suggestions and clean data visualizations, helping users confidently plan their tech careers.
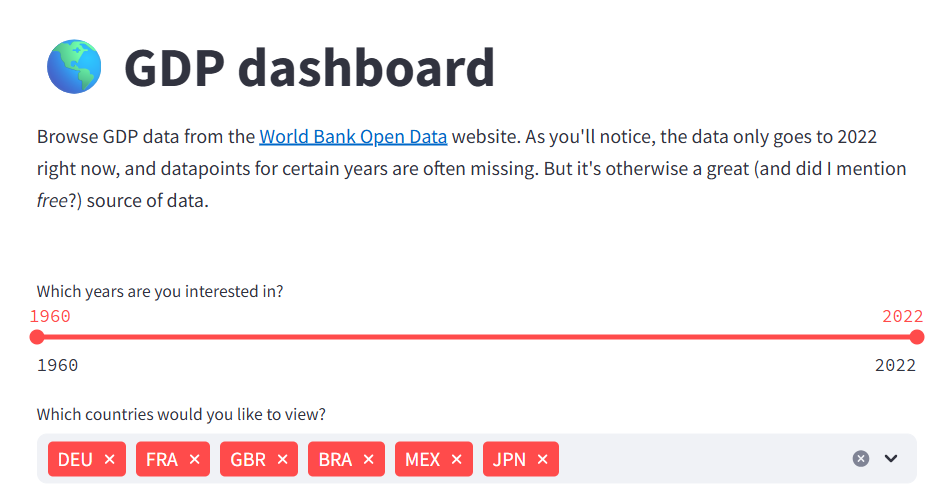
The GDP Dashboard is an interactive data visualization tool designed to analyze and compare the Gross Domestic Product (GDP) of various countries across multiple years. Using historical GDP data, the system allows users to filter by country, region, and time range to explore economic trends and performance. Developed using Python, Pandas, Plotly, and Streamlit, the dashboard presents key insights through interactive line graphs, bar charts, and world maps. Users can identify growth patterns, spot economic shifts, and make data-driven observations. The dashboard emphasizes ease of use and real-time interactivity, making it ideal for students, researchers, and policy analysts. It showcases practical skills in data cleaning, visualization, UI development, and deploying analytical tools for global economic insight.

Designed a Gesture-Controlled System that enables users to play Subway Surfers using hand gestures captured via webcam. The system uses OpenCV and MediaPipe for real-time hand tracking and gesture recognition. Specific gestures are mapped to in-game actions such as jumping, sliding, and moving left or right by simulating keyboard inputs using Python libraries like pyautogui or keyboard. This project focuses on enhancing interactivity and gaming experience through computer vision and human-computer interaction techniques. It demonstrates skills in real-time image processing, gesture classification, and input simulation. The system runs entirely offline and does not require web or cloud deployment, making it suitable for local gaming and accessibility-focused applications.
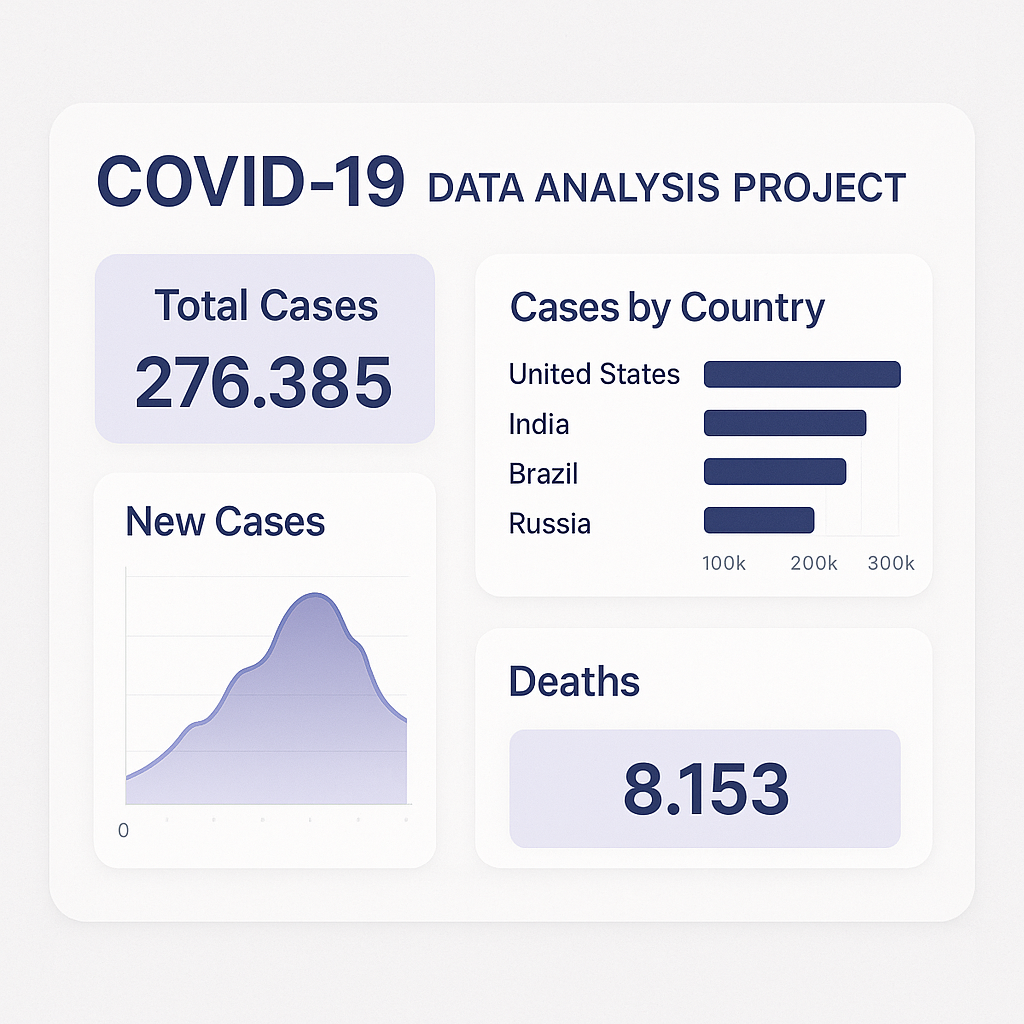
The COVID-19 Data Analysis Project focuses on exploring and analyzing the spread and impact of COVID-19 using real-world datasets. Implemented using Python, along with libraries such as Pandas, NumPy, Matplotlib, and Seaborn, the project includes data cleaning, transformation, and statistical analysis of confirmed cases, recoveries, and fatalities. It provides insights into trends over time, peak periods, country-wise comparisons, and recovery/fatality rates. Visualizations such as line graphs, bar charts, and heatmaps are used to highlight key findings. The project runs locally and demonstrates proficiency in data preprocessing, exploratory data analysis (EDA), and visual storytelling. It aims to give users a clearer understanding of the pandemic's behavior through analytical methods and data interpretation — without relying on web-based tools.
Certificates
Devtown Certificate
Completed on May-2024
CertifiedDatathon on TechSpectRuM24 Certificate
9th place in this event
Completed on October-2024
TCS iON Career Edge - Young Professional
Completed on June-2023
CertifiedAWS Educate Badge
Completed on December-2023
CertifiedProject Development Competition
Completed on August-2023
CertifiedAccenture North America - Data Analytics and Visualization Job Simulation
Completed on August-2024
CertifiedGUVI - Python Course on Multiple Language from IITM
Completed on October-2023
CertifiedAI Tools Workshop
Completed on February-2025
Certified